Gas consumption 2024 v 2025
Month-by-Month Comparison
| Month | 2024 Units | 2025 Units | Difference (Units) | % Reduction |
|---|---|---|---|---|
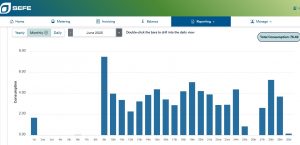
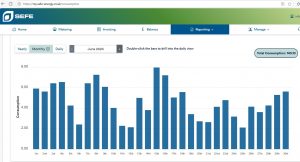
| June | 140.10 | 76.49 | 63.61 | 45.4% |
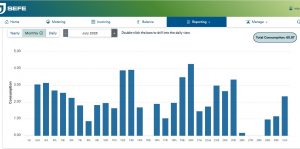
| July | 130.43 | 60.87 | 69.56 | 53.3% |
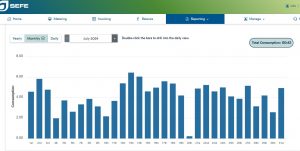
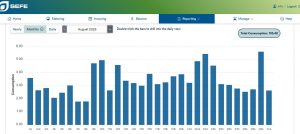
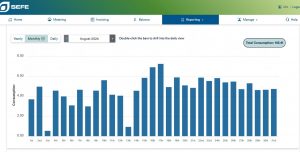
| August | 145.41 | 105.40 | 40.01 | 27.5% |
Analysis by Month:
-
June: Gas usage dropped significantly by 45%. This shows the system is already providing substantial savings immediately after installation.
-
July: The largest reduction of 53% occurred, suggesting peak efficiency during this month. Possibly due to lower heating demand or optimized hot water usage.
-
August: Savings are smaller, 27.5%, but still substantial. This could be due to higher usage needs in hot water during warmer days or more people in the household.
Combined 3-Month Comparison
-
Total 2024 (June–August): 140.10 + 130.43 + 145.41 = 415.94 units
-
Total 2025 (June–August): 76.49 + 60.87 + 105.40 = 242.76 units
Total Reduction: 415.94 − 242.76 = 173.18 units
Overall % Reduction: (173.18 ÷ 415.94) × 100 ≈ 41.6%
Analysis Overall:
-
The new hot water and heating system reduced total gas usage for the summer months by over 40%, which is substantial.
-
Savings are most pronounced in June and July, with August showing reduced efficiency but still contributing to overall savings.